EVIDENCE STUDIES · NO. 001 · 2026-11-05
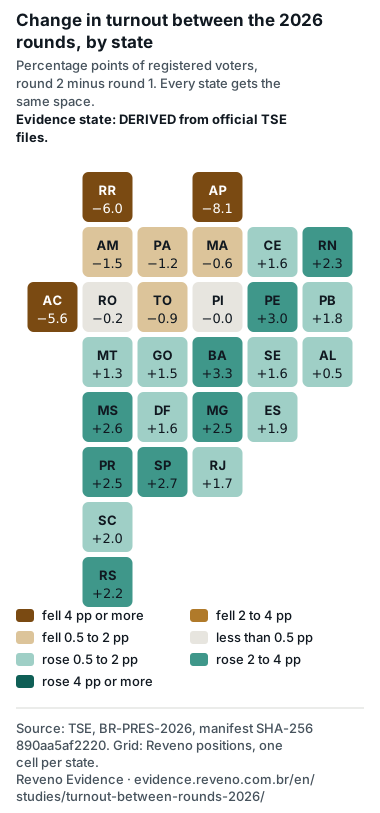
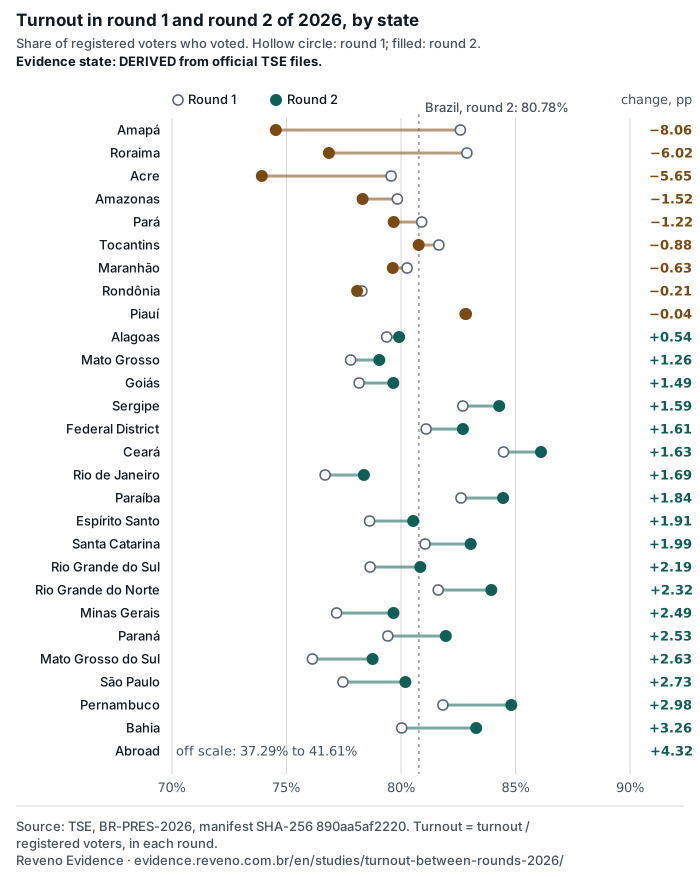
Between the 2026 rounds, turnout fell in all 7 Northern states and rose in 18 of the other 20.
From round 1 to round 2, the share of registered voters who voted rose nationally (from 78.92% to 80.78%), but not everywhere. Every Northern state recorded a drop; outside the North, only Maranhão and Piauí fell. The study shows where and by how much, and what the data does not allow us to say.
The numbers
- −8.06 pp
largest turnout drop between rounds, in Amapá. Next come Roraima (−6.02 pp) and Acre (−5.65 pp).
Derived See Fig. 1
- +3.26 pp
largest rise among the states, in Bahia. Next come Pernambuco (+2.98 pp) and São Paulo (+2.73 pp). Abroad, +4.32 pp, from a base of 37.29%.
Derived See Fig. 1
- −1.86 pp
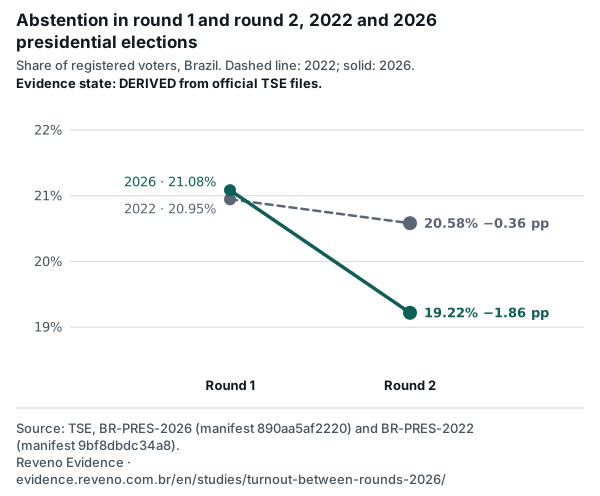
change in abstention from round 1 to round 2 in 2026 (from 21.08% to 19.22%). In 2022, −0.36 pp.
Derived See Fig. 2
- 21:48
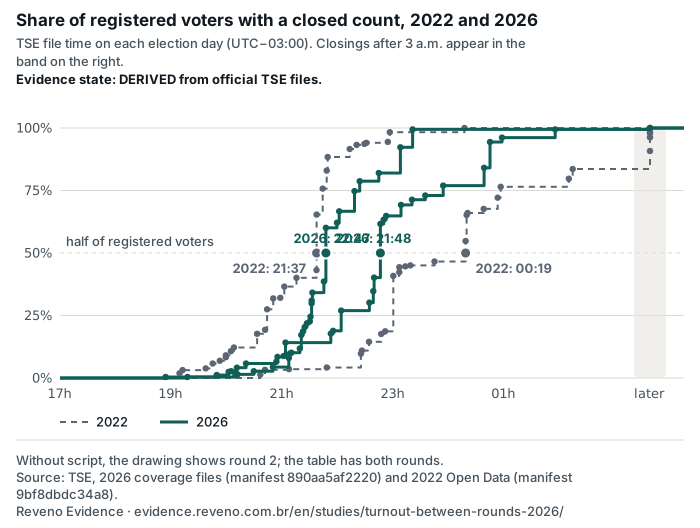
time at which states with a closed round 2 count passed half of registered voters in 2026. In 2022, 21:37.
Derived See Fig. 3
1. Turnout by state, from round 1 to round 2
Turnout is the share of registered voters who voted. The change is the difference, in percentage points (pp), between round 2 and round 1 in the same state. Teal marks a rise; copper, a drop. Color shows the direction of change, not a candidate or party.
See the table
| State | Region | Registered voters (round 2) | Turnout, round 1 | Turnout, round 2 | Change (pp) |
|---|---|---|---|---|---|
| Amapá | North | 576,910 | 82.59% | 74.53% | −8.06 |
| Roraima | North | 401,540 | 82.88% | 76.85% | −6.02 |
| Acre | North | 613,715 | 79.57% | 73.92% | −5.65 |
| Amazonas | North | 2,798,661 | 79.84% | 78.33% | −1.52 |
| Pará | North | 6,262,063 | 80.90% | 79.68% | −1.22 |
| Tocantins | North | 1,182,041 | 81.66% | 80.77% | −0.88 |
| Maranhão | Northeast | 5,183,049 | 80.27% | 79.64% | −0.63 |
| Rondônia | North | 1,265,926 | 78.29% | 78.08% | −0.21 |
| Piauí | Northeast | 2,704,695 | 82.85% | 82.81% | −0.04 |
| Alagoas | Northeast | 2,442,081 | 79.37% | 79.92% | +0.54 |
| Mato Grosso | Center-West | 2,637,879 | 77.80% | 79.05% | +1.26 |
| Goiás | Center-West | 5,080,385 | 78.17% | 79.66% | +1.49 |
| Sergipe | Northeast | 1,740,093 | 82.70% | 84.29% | +1.59 |
| Federal District | Center-West | 2,258,995 | 81.10% | 82.70% | +1.61 |
| Ceará | Northeast | 6,996,521 | 84.48% | 86.11% | +1.63 |
| Rio de Janeiro | Southeast | 12,857,526 | 76.68% | 78.38% | +1.69 |
| Paraíba | Northeast | 3,248,434 | 82.62% | 84.46% | +1.84 |
| Espírito Santo | Southeast | 2,991,515 | 78.63% | 80.53% | +1.91 |
| Santa Catarina | South | 5,734,687 | 81.05% | 83.04% | +1.99 |
| Rio Grande do Sul | South | 8,522,318 | 78.65% | 80.84% | +2.19 |
| Rio Grande do Norte | Northeast | 2,659,867 | 81.62% | 83.94% | +2.32 |
| Minas Gerais | Southeast | 16,372,144 | 77.19% | 79.67% | +2.49 |
| Paraná | South | 8,613,628 | 79.43% | 81.96% | +2.53 |
| Mato Grosso do Sul | Center-West | 2,024,437 | 76.13% | 78.76% | +2.63 |
| São Paulo | Southeast | 34,123,591 | 77.46% | 80.19% | +2.73 |
| Pernambuco | Northeast | 7,223,227 | 81.83% | 84.82% | +2.98 |
| Bahia | Northeast | 11,312,891 | 80.03% | 83.29% | +3.26 |
| Abroad | Abroad | 916,683 | 37.29% | 41.61% | +4.32 |
2. Abstention in both cycles
Abstention is the share of registered voters who did not vote. The slope of each line shows the change between rounds in the same year.
See the table
| Year | Round | Registered voters | Abstention | Abstention (% of registered voters) |
|---|---|---|---|---|
| 2022 | Round 1 | 156,454,011 | 32,770,982 | 20.95% |
| 2022 | Round 2 | 156,454,011 | 32,200,558 | 20.58% |
| 2026 | Round 1 | 158,745,502 | 33,469,244 | 21.08% |
| 2026 | Round 2 | 158,745,502 | 30,509,005 | 19.22% |
3. Counting night
Each step is a state (or abroad) whose count closed, at the time the TSE file records (UTC−03:00). The height is the share of registered voters already covered.
See the table
| Year | Round | Order | Scope | Closed at | Cumulative share of registered voters |
|---|---|---|---|---|---|
| 2026 | Round 1 | 1 | Acre | 0.4% | |
| 2026 | Round 1 | 2 | Rondônia | 1.2% | |
| 2026 | Round 1 | 3 | Mato Grosso do Sul | 2.5% | |
| 2026 | Round 1 | 4 | Roraima | 2.7% | |
| 2026 | Round 1 | 5 | Federal District | 4.1% | |
| 2026 | Round 1 | 6 | Mato Grosso | 5.8% | |
| 2026 | Round 1 | 7 | Tocantins | 6.5% | |
| 2026 | Round 1 | 8 | Espírito Santo | 8.4% | |
| 2026 | Round 1 | 9 | Amapá | 8.8% | |
| 2026 | Round 1 | 10 | Rio Grande do Sul | 14.2% | |
| 2026 | Round 1 | 11 | Santa Catarina | 17.8% | |
| 2026 | Round 1 | 12 | Sergipe | 18.9% | |
| 2026 | Round 1 | 13 | Rio de Janeiro | 27.0% | |
| 2026 | Round 1 | 14 | Goiás | 30.2% | |
| 2026 | Round 1 | 15 | Pernambuco | 34.7% | |
| 2026 | Round 1 | 16 | Paraná | 40.1% | |
| 2026 | Round 1 | 17 | São Paulo | 61.6% | |
| 2026 | Round 1 | 18 | Rio Grande do Norte | 63.3% | |
| 2026 | Round 1 | 19 | Alagoas | 64.9% | |
| 2026 | Round 1 | 20 | Ceará | 69.3% | |
| 2026 | Round 1 | 21 | Paraíba | 71.3% | |
| 2026 | Round 1 | 22 | Piauí | 73.0% | |
| 2026 | Round 1 | 23 | Pará | 77.0% | |
| 2026 | Round 1 | 24 | Bahia | 84.1% | |
| 2026 | Round 1 | 25 | Minas Gerais | 94.4% | |
| 2026 | Round 1 | 26 | Amazonas | 96.2% | |
| 2026 | Round 1 | 27 | Maranhão | 99.4% | |
| 2026 | Round 1 | 28 | Abroad | 100.0% | |
| 2026 | Round 2 | 1 | Acre | 0.4% | |
| 2026 | Round 2 | 2 | Rondônia | 1.2% | |
| 2026 | Round 2 | 3 | Roraima | 1.4% | |
| 2026 | Round 2 | 4 | Mato Grosso do Sul | 2.7% | |
| 2026 | Round 2 | 5 | Mato Grosso | 4.4% | |
| 2026 | Round 2 | 6 | Santa Catarina | 8.0% | |
| 2026 | Round 2 | 7 | Amazonas | 9.7% | |
| 2026 | Round 2 | 8 | Amapá | 10.1% | |
| 2026 | Round 2 | 9 | Rio Grande do Norte | 11.8% | |
| 2026 | Round 2 | 10 | Paraná | 17.2% | |
| 2026 | Round 2 | 11 | Federal District | 18.6% | |
| 2026 | Round 2 | 12 | Piauí | 20.3% | |
| 2026 | Round 2 | 13 | Alagoas | 21.9% | |
| 2026 | Round 2 | 14 | Tocantins | 22.6% | |
| 2026 | Round 2 | 15 | Espírito Santo | 24.5% | |
| 2026 | Round 2 | 16 | Rio Grande do Sul | 29.9% | |
| 2026 | Round 2 | 17 | Sergipe | 31.0% | |
| 2026 | Round 2 | 18 | Goiás | 34.2% | |
| 2026 | Round 2 | 19 | Ceará | 38.6% | |
| 2026 | Round 2 | 20 | São Paulo | 60.1% | |
| 2026 | Round 2 | 21 | Paraíba | 62.1% | |
| 2026 | Round 2 | 22 | Pernambuco | 66.7% | |
| 2026 | Round 2 | 23 | Rio de Janeiro | 74.8% | |
| 2026 | Round 2 | 24 | Pará | 78.7% | |
| 2026 | Round 2 | 25 | Maranhão | 82.0% | |
| 2026 | Round 2 | 26 | Minas Gerais | 92.3% | |
| 2026 | Round 2 | 27 | Bahia | 99.4% | |
| 2026 | Round 2 | 28 | Abroad | 100.0% | |
| 2022 | Round 1 | 1 | Federal District | 1.4% | |
| 2022 | Round 1 | 2 | Espírito Santo | 3.3% | |
| 2022 | Round 1 | 3 | Roraima | 3.5% | |
| 2022 | Round 1 | 4 | Tocantins | 4.2% | |
| 2022 | Round 1 | 5 | Rio Grande do Sul | 9.7% | |
| 2022 | Round 1 | 6 | Mato Grosso do Sul | 11.0% | |
| 2022 | Round 1 | 7 | Santa Catarina | 14.5% | |
| 2022 | Round 1 | 8 | Goiás | 17.6% | |
| 2022 | Round 1 | 9 | Sergipe | 18.7% | |
| 2022 | Round 1 | 10 | São Paulo | 40.8% | |
| 2022 | Round 1 | 11 | Alagoas | 42.3% | |
| 2022 | Round 1 | 12 | Paraíba | 44.3% | |
| 2022 | Round 1 | 13 | Amapá | 44.7% | |
| 2022 | Round 1 | 14 | Acre | 45.0% | |
| 2022 | Round 1 | 15 | Mato Grosso | 46.6% | |
| 2022 | Round 1 | 16 | Rio de Janeiro | 54.8% | |
| 2022 | Round 1 | 17 | Minas Gerais | 65.2% | |
| 2022 | Round 1 | 18 | Rondônia | 66.0% | |
| 2022 | Round 1 | 19 | Rio Grande do Norte | 67.6% | |
| 2022 | Round 1 | 20 | Pernambuco | 72.1% | |
| 2022 | Round 1 | 21 | Ceará | 76.5% | |
| 2022 | Round 1 | 22 | Maranhão | 79.7% | |
| 2022 | Round 1 | 23 | Pará | 83.6% | |
| 2022 | Round 1 | 24 | Bahia | 90.8% | |
| 2022 | Round 1 | 25 | Paraná | 96.2% | |
| 2022 | Round 1 | 26 | Piauí | 97.9% | |
| 2022 | Round 1 | 27 | Abroad | 98.3% | |
| 2022 | Round 1 | 28 | Amazonas | 100.0% | |
| 2022 | Round 2 | 1 | Espírito Santo | 1.9% | |
| 2022 | Round 2 | 2 | Mato Grosso do Sul | 3.1% | |
| 2022 | Round 2 | 3 | Tocantins | 3.8% | |
| 2022 | Round 2 | 4 | Paraíba | 5.8% | |
| 2022 | Round 2 | 5 | Sergipe | 6.9% | |
| 2022 | Round 2 | 6 | Federal District | 8.3% | |
| 2022 | Round 2 | 7 | Rondônia | 9.1% | |
| 2022 | Round 2 | 8 | Rio Grande do Norte | 10.7% | |
| 2022 | Round 2 | 9 | Alagoas | 12.2% | |
| 2022 | Round 2 | 10 | Rio Grande do Sul | 17.7% | |
| 2022 | Round 2 | 11 | Mato Grosso | 19.3% | |
| 2022 | Round 2 | 12 | Rio de Janeiro | 27.5% | |
| 2022 | Round 2 | 13 | Ceará | 31.8% | |
| 2022 | Round 2 | 14 | Roraima | 32.1% | |
| 2022 | Round 2 | 15 | Pernambuco | 36.5% | |
| 2022 | Round 2 | 16 | Santa Catarina | 40.1% | |
| 2022 | Round 2 | 17 | Goiás | 43.2% | |
| 2022 | Round 2 | 18 | São Paulo | 65.3% | |
| 2022 | Round 2 | 19 | Minas Gerais | 75.8% | |
| 2022 | Round 2 | 20 | Bahia | 83.0% | |
| 2022 | Round 2 | 21 | Paraná | 88.4% | |
| 2022 | Round 2 | 22 | Maranhão | 91.6% | |
| 2022 | Round 2 | 23 | Piauí | 93.3% | |
| 2022 | Round 2 | 24 | Acre | 93.6% | |
| 2022 | Round 2 | 25 | Abroad | 94.1% | |
| 2022 | Round 2 | 26 | Amapá | 94.4% | |
| 2022 | Round 2 | 27 | Pará | 98.3% | |
| 2022 | Round 2 | 28 | Amazonas | 100.0% |
Method and limits
Registered voters, turnout and abstention for every state and for Brazil come from the TSE consolidated result file of each round, with the SHA-256 checked at every publication. Closing times come from the TSE coverage files (2026) and TSE Open Data (2022). The formulas above are the only calculations; no number was typed.
turnout_pct = 100 × turnout / registered_voters
change_pp = turnout_pct_round2 − turnout_pct_round1
abstention_pct = 100 × abstention / registered_voters
cumulative_share(t) = registered voters of scopes closed by t / total registered voters
What the data does not allow us to say
- The data says how much turnout changed, not why. Weather, travel, transport and interest are not in the files and are not inferred here.
- Turnout is counted by state; the study says nothing about municipalities, zones or people.
- Voting abroad has a small base and much lower turnout; it is off the scale in Fig. 1 and reported separately.
- Fig. 3 times are those recorded in the file, not the moment results were announced.
- A change in turnout does not indicate an advantage for any candidate.
Authorship and review
Written by Thiago Holtz for Reveno Evidence and published on November 5, 2026. Internal review; no independent review yet. Corrections are added here, dated, without deleting the previous version.
History
- Version 1, November 5, 2026: publication.
About this data
- What it measures
- Turnout and abstention by state and in Brazil in both 2026 rounds, national abstention in 2022 and the count closing time by scope, in 2022 and 2026.
- Source
- Brazil's Superior Electoral Court (TSE): 56 consolidated result files for 2026 (one per scope and round), listed in the 2026 case manifest, and the 2022 case manifest.
- Unit
- Share of registered voters; percentage points (pp) for change; file time (UTC−03:00).
- Period
- 2022 presidential election (October 2 and 30) and 2026 (October 4 and 25).
- Last collected
- Next scheduled collection
- Not applicable: the study is a dated edition. If the TSE files change, the page says so and recalculates.
- Maintained by
- Thiago Holtz, Reveno Evidence
- Evidence state
- Derived
- Version
- Case manifests: 2026
890aa5af22204752, 20229bf8dbdc34a88f3d - License
- Text, figures and calculations of this study: CC BY 4.0, with attribution to Reveno Evidence and a link to this page. Source data: Brazil's Superior Electoral Court (TSE), public data, under the court's terms.
Download the data
What is on screen
The tables on this page as CSV, with unformatted numbers and the evidence state of every row.
The full set, with a manifest
A ZIP with every file behind the page, a README with the citation and license, and a manifest with the SHA-256 of each file.
For machines
A JSON at a stable address, with metadata, citation, tables and sources. The address does not change between publications; the content changes when the collection changes.
- dados.json
https://evidence.reveno.com.br/estudos/comparecimento-entre-turnos-2026/dados.json
- dados.json
How to cite
Short citation for a chart or table caption, or a note
TSE (2026), processed by Reveno Evidence
Full citation with URL and access date
Reveno Evidence (2026). Between the 2026 rounds, turnout fell in all 7 Northern states and rose in 18 of the other 20 [Data set]. Evidence Studies no. 001, by Thiago Holtz. Source data: Brazil's Superior Electoral Court (TSE), cases BR-PRES-2026 and BR-PRES-2022. Manifests SHA-256 890aa5af22204752 and 9bf8dbdc34a88f3d. Retrieved November 5, 2026, from https://evidence.reveno.com.br/en/studies/turnout-between-rounds-2026/
BibTeX
@misc{reveno_evidence_estudo_001,
  author = {{Reveno Evidence}},
  title = {Between the 2026 rounds, turnout fell in all 7 Northern states and rose in 18 of the other 20},
  year = {2026},
  publisher = {Reveno},
  url = {https://evidence.reveno.com.br/en/studies/turnout-between-rounds-2026/},
  urldate = {2026-11-05},
  note = {Evidence Studies no. 001, by Thiago Holtz. Source data: Brazil's Superior Electoral Court (TSE), cases BR-PRES-2026 and BR-PRES-2022. Manifests SHA-256 890aa5af22204752 and 9bf8dbdc34a88f3d}
}
The access date is filled in with the date of this version of the page; replace it with the date you accessed it.
When you use a number, also cite the source file: id, URL and SHA-256 are in the sources table.
Text, figures and calculations of this study: CC BY 4.0, with attribution to Reveno Evidence and a link to this page. Source data: Brazil's Superior Electoral Court (TSE), public data, under the court's terms.