ELECTION MAPS · BR-PRES-2026 · DERIVED FROM TSE FILES
The 2026 presidential election in maps: swing, most voted by state and counting.
Four drawings generated at publication time from the official TSE files of the case, each with the equivalent table beside it and the state of every number. No script, no library and no tracking: the SVG is text inside the page and also a file to embed.
How to read this page
The drawings come from the same case files the main page uses, with SHA-256 checked every time this page is generated. No number is typed by hand and each drawing has a table with the same values, for screen readers, copying and checking.
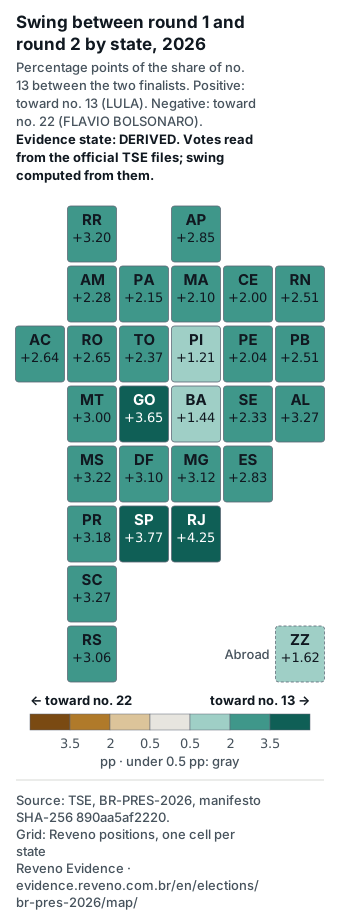
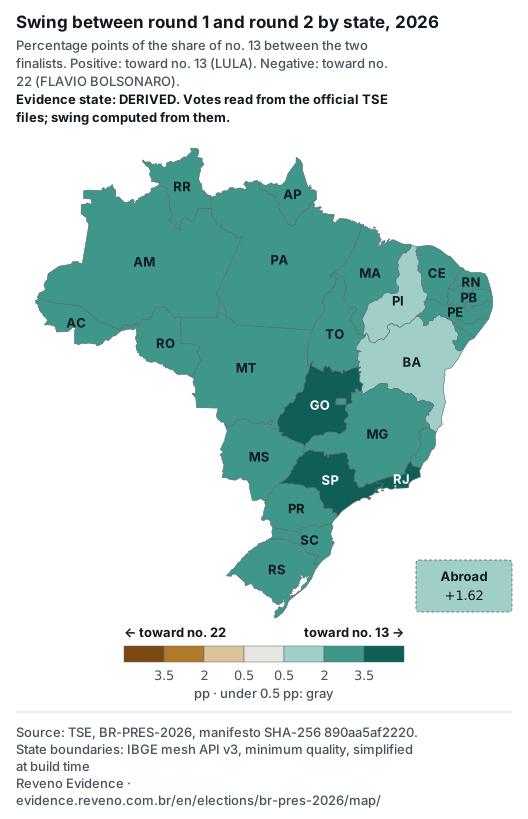
The form follows the relation in the data: swing is a deviation around zero and comes first as ordered diverging bars; the result is a ranking in bars from zero; counting is change over time, as a line with markers. For the "where" question there is a grid cartogram, where every state has the same size and no small state disappears, and a supporting geographic map. The grid positions are our own and are documented at the end of the page.
Colors belong to no party or candidacy. The diverging scale runs from copper to petrol and encodes the sign of the axis: right of zero (petrol) favors no. 13, the lower ballot number among the finalists; left (copper) favors no. 22. The value is always written. Bands are fixed and identical across cycles, so cases can be compared. In the national result every bar is the same gray: no candidacy is highlighted.
The text gives no opinion on candidates, parties or institutions and makes no forecast. Swing and margin describe the published results; they do not say why votes changed.
- Observed
- Number read from an official file, with URL, date and SHA-256 in the manifest.
- Derived
- Computed from official files: sums, shares, swing, margin and cumulative share. The formula appears under each drawing.
- Unknown
- What no collected file supports. Shown with the reason.
1. Swing by state between rounds
Change, in percentage points, of the share of no. 13 between the two finalists. In round 1 the base is only the votes of the two; in round 2, valid votes. Positive means a shift toward no. 13; negative, toward the other finalist. Swing is derived.
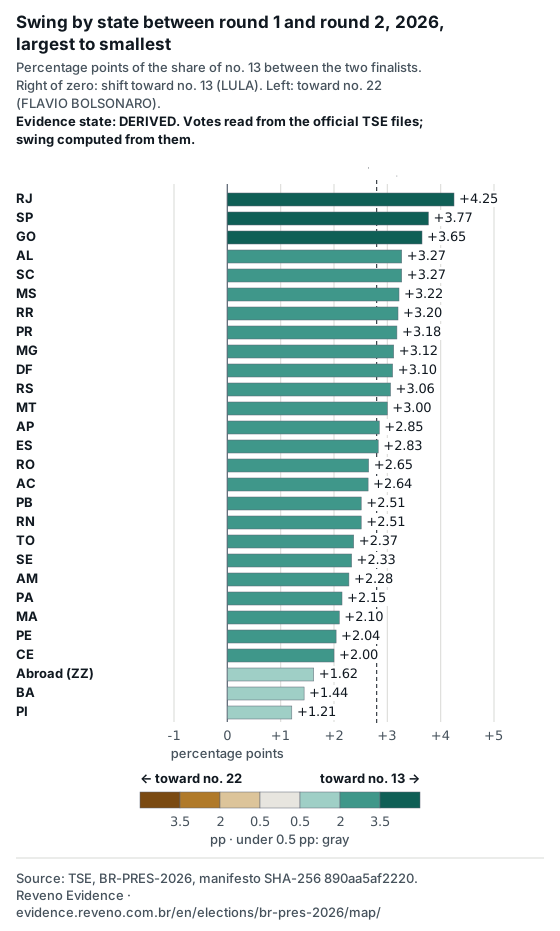
| Scope | Round 2 registered voters Observed | Share of no. 13 in round 1, between the two Derived | Share of no. 13 in round 2 Derived | Swing of no. 13 (pp) Derived | Scale band |
|---|---|---|---|---|---|
| AC | 613,715 | 30.80% | 33.43% | +2.64 | 2.0 to 3.5 pp toward no. 13 |
| AL | 2,442,081 | 57.50% | 60.77% | +3.27 | 2.0 to 3.5 pp toward no. 13 |
| AM | 2,798,661 | 51.74% | 54.02% | +2.28 | 2.0 to 3.5 pp toward no. 13 |
| AP | 576,910 | 50.03% | 52.88% | +2.85 | 2.0 to 3.5 pp toward no. 13 |
| BA | 11,312,891 | 69.87% | 71.31% | +1.44 | 0.5 to 2.0 pp toward no. 13 |
| CE | 6,996,521 | 66.93% | 68.93% | +2.00 | 2.0 to 3.5 pp toward no. 13 |
| DF | 2,258,995 | 42.62% | 45.73% | +3.10 | 2.0 to 3.5 pp toward no. 13 |
| ES | 2,991,515 | 40.80% | 43.63% | +2.83 | 2.0 to 3.5 pp toward no. 13 |
| GO | 5,080,385 | 36.69% | 40.34% | +3.65 | 3.5 or more pp toward no. 13 |
| MA | 5,183,049 | 67.44% | 69.54% | +2.10 | 2.0 to 3.5 pp toward no. 13 |
| MG | 16,372,144 | 47.32% | 50.43% | +3.12 | 2.0 to 3.5 pp toward no. 13 |
| MS | 2,024,437 | 37.18% | 40.40% | +3.22 | 2.0 to 3.5 pp toward no. 13 |
| MT | 2,637,879 | 30.94% | 33.94% | +3.00 | 2.0 to 3.5 pp toward no. 13 |
| PA | 6,262,063 | 52.87% | 55.02% | +2.15 | 2.0 to 3.5 pp toward no. 13 |
| PB | 3,248,434 | 64.96% | 67.46% | +2.51 | 2.0 to 3.5 pp toward no. 13 |
| PE | 7,223,227 | 67.16% | 69.20% | +2.04 | 2.0 to 3.5 pp toward no. 13 |
| PI | 2,704,695 | 74.67% | 75.88% | +1.21 | 0.5 to 2.0 pp toward no. 13 |
| PR | 8,613,628 | 34.24% | 37.42% | +3.18 | 2.0 to 3.5 pp toward no. 13 |
| RJ | 12,857,526 | 42.64% | 46.90% | +4.25 | 3.5 or more pp toward no. 13 |
| RN | 2,659,867 | 63.21% | 65.72% | +2.51 | 2.0 to 3.5 pp toward no. 13 |
| RO | 1,265,926 | 27.74% | 30.39% | +2.65 | 2.0 to 3.5 pp toward no. 13 |
| RR | 401,540 | 24.34% | 27.54% | +3.20 | 2.0 to 3.5 pp toward no. 13 |
| RS | 8,522,318 | 39.10% | 42.16% | +3.06 | 2.0 to 3.5 pp toward no. 13 |
| SC | 5,734,687 | 27.31% | 30.58% | +3.27 | 2.0 to 3.5 pp toward no. 13 |
| SE | 1,740,093 | 67.20% | 69.53% | +2.33 | 2.0 to 3.5 pp toward no. 13 |
| SP | 34,123,591 | 42.38% | 46.15% | +3.77 | 3.5 or more pp toward no. 13 |
| TO | 1,182,041 | 46.26% | 48.63% | +2.37 | 2.0 to 3.5 pp toward no. 13 |
| Abroad (ZZ) | 916,683 | 52.24% | 53.86% | +1.62 | 0.5 to 2.0 pp toward no. 13 |
| Brazil | n/a | 48.99% | 51.79% | +2.80 | 2.0 to 3.5 pp toward no. 13 |
Formula first_round_two_candidate_normalized_share = v1_A / (v1_A + v1_B); second_round_share = v2_A / valid_t2; swing_pp = 100 * (second - first); absolute_vote_gain = v2_A - v1_A
Where: position by state
2. Most voted by state in round 2
Color shows which finalist was ahead in each state and abroad; intensity shows the margin in percentage points of valid votes. The margin is derived from the round 2 shares.
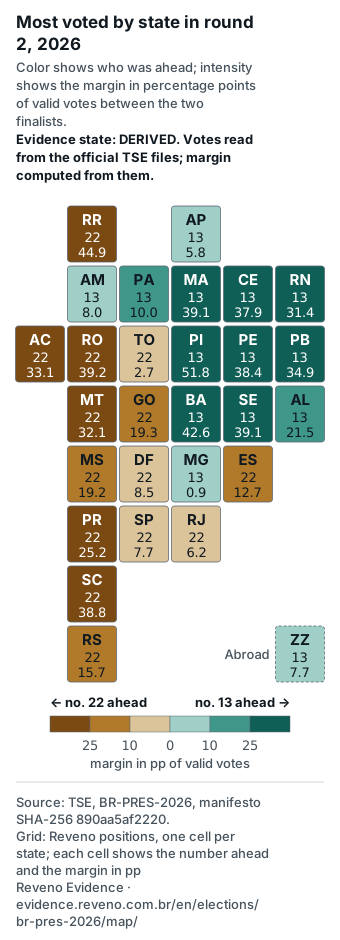
| Scope | Ahead in round 2 | Share of no. 13 Derived | Share of no. 22 Derived | Margin (pp) Derived |
|---|---|---|---|---|
| AC | nº 22 FLAVIO BOLSONARO | 33.43% | 66.57% | 33.13 |
| AL | nº 13 LULA | 60.77% | 39.23% | 21.54 |
| AM | nº 13 LULA | 54.02% | 45.98% | 8.04 |
| AP | nº 13 LULA | 52.88% | 47.12% | 5.76 |
| BA | nº 13 LULA | 71.31% | 28.69% | 42.63 |
| CE | nº 13 LULA | 68.93% | 31.07% | 37.86 |
| DF | nº 22 FLAVIO BOLSONARO | 45.73% | 54.28% | 8.55 |
| ES | nº 22 FLAVIO BOLSONARO | 43.63% | 56.37% | 12.74 |
| GO | nº 22 FLAVIO BOLSONARO | 40.34% | 59.66% | 19.33 |
| MA | nº 13 LULA | 69.54% | 30.46% | 39.08 |
| MG | nº 13 LULA | 50.43% | 49.57% | 0.87 |
| MS | nº 22 FLAVIO BOLSONARO | 40.40% | 59.60% | 19.20 |
| MT | nº 22 FLAVIO BOLSONARO | 33.94% | 66.06% | 32.12 |
| PA | nº 13 LULA | 55.02% | 44.99% | 10.03 |
| PB | nº 13 LULA | 67.46% | 32.54% | 34.93 |
| PE | nº 13 LULA | 69.20% | 30.80% | 38.40 |
| PI | nº 13 LULA | 75.88% | 24.12% | 51.75 |
| PR | nº 22 FLAVIO BOLSONARO | 37.42% | 62.58% | 25.15 |
| RJ | nº 22 FLAVIO BOLSONARO | 46.90% | 53.10% | 6.20 |
| RN | nº 13 LULA | 65.72% | 34.28% | 31.44 |
| RO | nº 22 FLAVIO BOLSONARO | 30.39% | 69.61% | 39.22 |
| RR | nº 22 FLAVIO BOLSONARO | 27.54% | 72.46% | 44.91 |
| RS | nº 22 FLAVIO BOLSONARO | 42.16% | 57.84% | 15.67 |
| SC | nº 22 FLAVIO BOLSONARO | 30.58% | 69.42% | 38.84 |
| SE | nº 13 LULA | 69.53% | 30.47% | 39.07 |
| SP | nº 22 FLAVIO BOLSONARO | 46.15% | 53.85% | 7.69 |
| TO | nº 22 FLAVIO BOLSONARO | 48.63% | 51.37% | 2.74 |
| Abroad (ZZ) | nº 13 LULA | 53.86% | 46.15% | 7.71 |
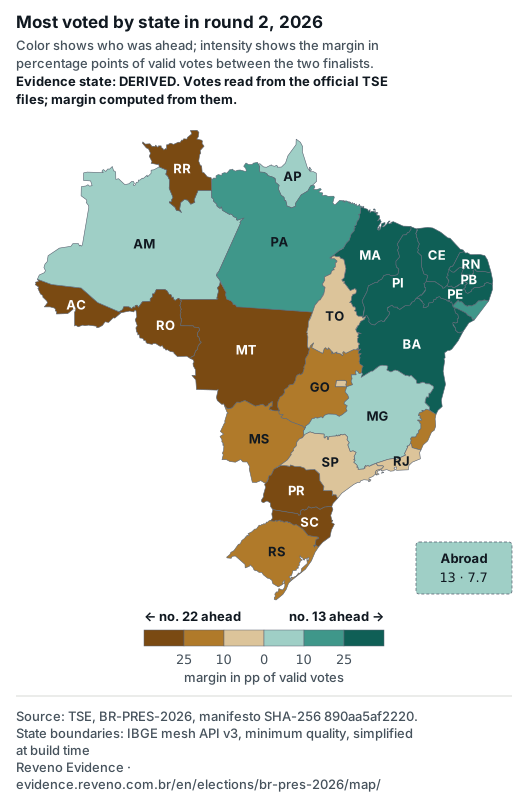
Formula margin_pp = 100 * |second_round_share_A - second_round_share_B|; ahead = larger second_round_share
3. Counting curve
Cumulative share of registered voters in states and abroad whose count had closed, by closing time, in both rounds. The axis uses the time as the file states it, with no time zone conversion. Very late closings appear after an axis break, with the time in the table.
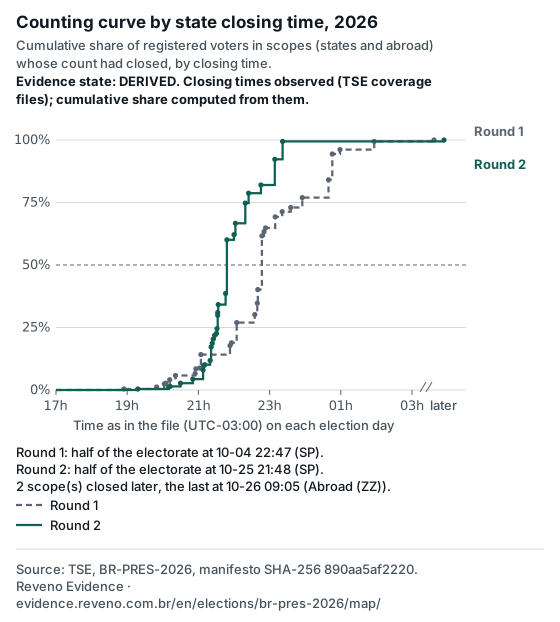
| Order | Scope | Closed at (UTC-03:00) Observed | Cumulative share Derived |
|---|---|---|---|
| 1 | AC | 0.4% | |
| 2 | RO | 1.2% | |
| 3 | MS | 2.5% | |
| 4 | RR | 2.7% | |
| 5 | DF | 4.1% | |
| 6 | MT | 5.8% | |
| 7 | TO | 6.5% | |
| 8 | ES | 8.4% | |
| 9 | AP | 8.8% | |
| 10 | RS | 14.2% | |
| 11 | SC | 17.8% | |
| 12 | SE | 18.9% | |
| 13 | RJ | 27.0% | |
| 14 | GO | 30.2% | |
| 15 | PE | 34.7% | |
| 16 | PR | 40.1% | |
| 17 | SP | 61.6% | |
| 18 | RN | 63.3% | |
| 19 | AL | 64.9% | |
| 20 | CE | 69.3% | |
| 21 | PB | 71.3% | |
| 22 | PI | 73.0% | |
| 23 | PA | 77.0% | |
| 24 | BA | 84.1% | |
| 25 | MG | 94.4% | |
| 26 | AM | 96.2% | |
| 27 | MA | 99.4% | |
| 28 | Abroad (ZZ) | 100.0% |
| Order | Scope | Closed at (UTC-03:00) Observed | Cumulative share Derived |
|---|---|---|---|
| 1 | AC | 0.4% | |
| 2 | RO | 1.2% | |
| 3 | RR | 1.4% | |
| 4 | MS | 2.7% | |
| 5 | MT | 4.4% | |
| 6 | SC | 8.0% | |
| 7 | AM | 9.7% | |
| 8 | AP | 10.1% | |
| 9 | RN | 11.8% | |
| 10 | PR | 17.2% | |
| 11 | DF | 18.6% | |
| 12 | PI | 20.3% | |
| 13 | AL | 21.9% | |
| 14 | TO | 22.6% | |
| 15 | ES | 24.5% | |
| 16 | RS | 29.9% | |
| 17 | SE | 31.0% | |
| 18 | GO | 34.2% | |
| 19 | CE | 38.6% | |
| 20 | SP | 60.1% | |
| 21 | PB | 62.1% | |
| 22 | PE | 66.7% | |
| 23 | RJ | 74.8% | |
| 24 | PA | 78.7% | |
| 25 | MA | 82.0% | |
| 26 | MG | 92.3% | |
| 27 | BA | 99.4% | |
| 28 | Abroad (ZZ) | 100.0% |
Formula cumulative_electorate_share = sum(electorate dos escopos fechados até t) / sum(electorate)
4. National result
Percentage of valid votes by candidacy in each round, with the 50% of valid votes line as a reference.
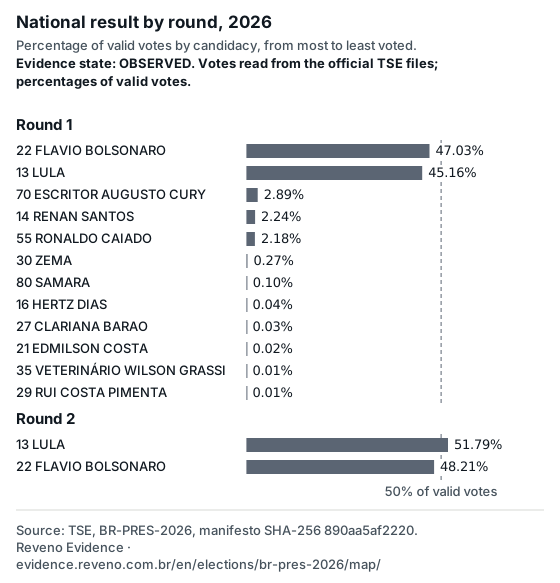
| Round | No. | Candidacy | Party | Votes Observed | % of valid Derived |
|---|---|---|---|---|---|
| Round 1 | 22 | FLAVIO BOLSONARO | PL | 56,104,503 | 47.03% |
| Round 1 | 13 | LULA | PT | 53,879,538 | 45.16% |
| Round 1 | 70 | ESCRITOR AUGUSTO CURY | AVANTE | 3,448,569 | 2.89% |
| Round 1 | 14 | RENAN SANTOS | MISSÃO | 2,675,887 | 2.24% |
| Round 1 | 55 | RONALDO CAIADO | PSD | 2,605,148 | 2.18% |
| Round 1 | 30 | ZEMA | NOVO | 326,488 | 0.27% |
| Round 1 | 80 | SAMARA | UP | 122,911 | 0.10% |
| Round 1 | 16 | HERTZ DIAS | PSTU | 43,103 | 0.04% |
| Round 1 | 27 | CLARIANA BARAO | DC | 40,043 | 0.03% |
| Round 1 | 21 | EDMILSON COSTA | PCB | 22,693 | 0.02% |
| Round 1 | 35 | VETERINÁRIO WILSON GRASSI | DEMOCRATA | 16,881 | 0.01% |
| Round 1 | 29 | RUI COSTA PIMENTA | PCO | 15,024 | 0.01% |
| Round 2 | 13 | LULA | PT | 64,256,232 | 51.79% |
| Round 2 | 22 | FLAVIO BOLSONARO | PL | 59,826,041 | 48.21% |
5. To embed
Each drawing is a static SVG file, with no script, carrying title, description, evidence state, source and credit inside the file. To use it, embed it by its address and keep the link to this page.
- https://evidence.reveno.com.br/en/elections/br-pres-2026/bars-swing.svg
- https://evidence.reveno.com.br/en/elections/br-pres-2026/cartogram-swing.svg
- https://evidence.reveno.com.br/en/elections/br-pres-2026/map-swing.svg
- https://evidence.reveno.com.br/en/elections/br-pres-2026/cartogram-winner.svg
- https://evidence.reveno.com.br/en/elections/br-pres-2026/map-winner.svg
- https://evidence.reveno.com.br/en/elections/br-pres-2026/counting-curve.svg
- https://evidence.reveno.com.br/en/elections/br-pres-2026/national-result.svg
<img src="https://evidence.reveno.com.br/en/elections/br-pres-2026/bars-swing.svg" width="560" alt="Swing by state between round 1 and round 2, 2026, largest to smallest">6. Sources and drawing method
State boundaries from the official IBGE mesh API, at minimum quality, stored unchanged and checked by SHA-256. At build time the mesh is projected (equirectangular corrected by the mean latitude) and simplified with Douglas-Peucker at a tolerance of 0.6 drawing unit(s): from 4985 to 2180 points. The IBGE Localities API state table links each polygon code to the state abbreviation.
| ID | URL | Downloaded at | SHA-256 | Bytes | State |
|---|---|---|---|---|---|
ibge-malha-uf-minima | https://servicodados.ibge.gov.br/api/v3/malhas/paises/BR?formato=application/vnd.geo%2Bjson&qualidade=minima&intrarregiao=UF | 07c671aa87aa1ab296c446de6294df9827112782537b996c0a160284907e7c0f | 98,502 | Observed | |
ibge-localidades-estados | https://servicodados.ibge.gov.br/api/v1/localidades/estados?orderBy=nome | 6b001067b04e037095410ce8d33e11a2d77bf63750354a09608b12f086324f04 | 2,446 | Observed |
Grid positions (column, row) are our own: they approximate real neighbors, with the North at the top left, the Northeast at the top right, the Center-West in the middle and the Southeast and South going down; abroad (ZZ) sits outside the mainland. They are not IBGE data.
7. About this data
- What it measures
- Swing by state between rounds, finalist ahead and margin by state in round 2, counting curve and national result, drawn as SVG from the same tables.
- Source
- Brazil's Superior Electoral Court (TSE), through the case files; state boundaries from IBGE, collected on .
- Unit
- Percentage points (pp) for swing and margin; share of valid votes; cumulative share of registered voters.
- Period
- and
- Last collected
- Next scheduled collection
- Daily at 09:30 UTC (06:30 in Brasília), by the
evidence-tseengine, which checks the SHA-256 of every file. This page changes on the next site publication. IBGE boundaries: no scheduled collection; they change only with a new manual collection recorded in the manifest. - Maintained by
- Reveno Evidence ·
evidence-tseengine, owner Thiago Holtz - Evidence state
- Derived Observed
- Version
- Collection manifest, SHA-256
890aa5af22204752879a7d89e3612e93c9a043f857a52a78e060ec6b82c03352 - License
- Source data license: public data from the TSE and IBGE, under each body's terms (credit IBGE for the boundaries). License for the Reveno drawings, text and calculations: not declared yet; until then, cite this page.
8. Download the data
What is on screen
The tables on this page as CSV, with unformatted numbers and the evidence state of every row.
The full set, with a manifest
A ZIP with every file behind the page, a README with the citation and license, and a manifest with the SHA-256 of each file.
For machines
A JSON at a stable address, with metadata, citation, tables and sources. The address does not change between publications; the content changes when the collection changes.
- Map data for machines
https://evidence.reveno.com.br/eleicoes/br-pres-2026/mapa/dados.json
- Map data for machines
9. How to cite
Short citation for a chart or table caption, or a note
TSE e IBGE (2026), processed by Reveno Evidence
Full citation with URL and access date
Reveno Evidence (2026). The 2026 presidential election in maps: swing, most voted by state and counting (BR-PRES-2026) [Data set]. Source data: Brazil's Superior Electoral Court (TSE), collected on 2026-11-02 (UTC), and IBGE state boundaries. Collection manifest, SHA-256 890aa5af22204752879a7d89e3612e93c9a043f857a52a78e060ec6b82c03352. Retrieved November 2, 2026, from https://evidence.reveno.com.br/en/elections/br-pres-2026/map/
BibTeX
@misc{reveno_evidence_br_pres_2026_mapas,
  author = {{Reveno Evidence}},
  title = {The 2026 presidential election in maps: swing, most voted by state and counting (BR-PRES-2026)},
  year = {2026},
  publisher = {Reveno},
  url = {https://evidence.reveno.com.br/en/elections/br-pres-2026/map/},
  urldate = {2026-11-02},
  note = {Source data: Brazil's Superior Electoral Court (TSE), collected on 2026-11-02 (UTC), and IBGE state boundaries. Collection manifest, SHA-256 890aa5af22204752879a7d89e3612e93c9a043f857a52a78e060ec6b82c03352}
}
The access date is filled in with the date of this version of the page; replace it with the date you accessed it.
When you use a number, also cite the source file: id, URL and SHA-256 are in the sources table.
Source data license: public data from the TSE and IBGE, under each body's terms (credit IBGE for the boundaries). License for the Reveno drawings, text and calculations: not declared yet; until then, cite this page.