EVIDENCE STUDIES · NO. 003 · 2026-11-06
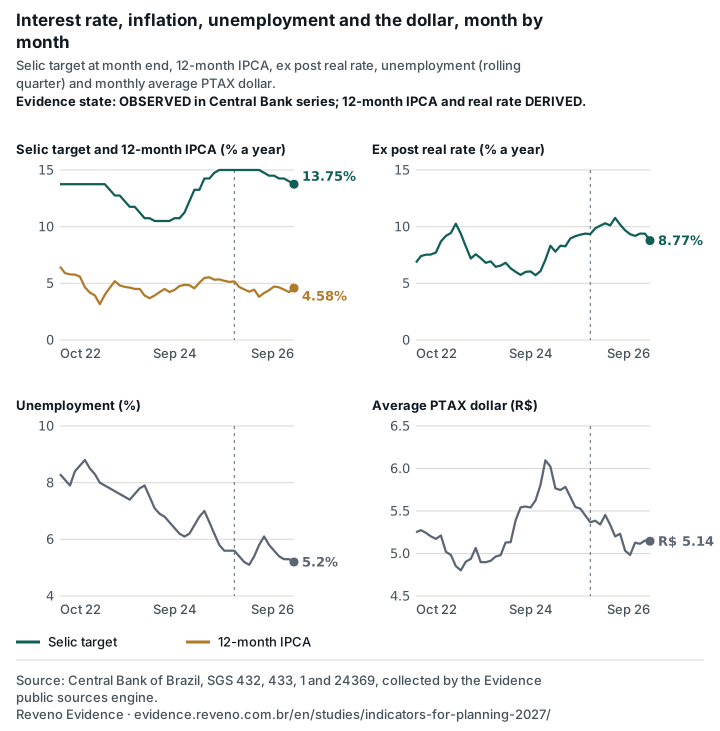
In September 2026, the Selic target was 13.75% and 12-month IPCA inflation 4.58%: a real rate of 8.77% a year, net of past inflation.
Five numbers that go into any budget: interest rate, inflation, real rate, unemployment and the dollar, read from Central Bank series with SHA-256, up to September 2026, and compared with twelve months earlier. There is no forecast: the study shows the starting point for 2027.
The numbers
- 8.77%
ex post real rate in September 2026: Selic target of 13.75% net of 12-month IPCA. Twelve months earlier, 9.34%.
Derived See Fig. 1
- 4.58%
12-month IPCA up to September 2026; −0.60 point(s) against twelve months earlier (5.17%).
Derived See Fig. 1
- 5.2%
unemployment in the rolling quarter ending in September 2026, against 5.6% twelve months earlier. The lowest value in the window was 5.1%, in December 2025.
Derived See Fig. 1
- R$ 5.14
average PTAX dollar in September 2026, −4.1% in twelve months. Latest daily value: R$ 5.4212, on 2026-10-30.
Derived See Fig. 1
1. Five years in four panels
Each panel has its own scale. Hover or use the arrow keys to read each month. The dashed line marks twelve months before the last month.
See the table
| Month | Selic target (% a year) | IPCA in the month (%) | 12-month IPCA (%) | Ex post real rate (% a year) | Unemployment (%) | Average PTAX dollar (R$) |
|---|---|---|---|---|---|---|
| Sep 26 | 13.75 | 0.82 | 4.58 | 8.77 | 5.2 | 5.1447 |
| Aug 26 | 14.00 | -0.32 | 4.22 | 9.38 | 5.3 | 5.1532 |
| Jul 26 | 14.25 | 0.07 | 4.44 | 9.39 | 5.3 | 5.1139 |
| Jun 26 | 14.25 | 0.16 | 4.64 | 9.18 | 5.4 | 5.1276 |
| May 26 | 14.50 | 0.58 | 4.72 | 9.33 | 5.6 | 4.9837 |
| Apr 26 | 14.50 | 0.67 | 4.39 | 9.68 | 5.8 | 5.0331 |
| Mar 26 | 14.75 | 0.88 | 4.14 | 10.19 | 6.1 | 5.2316 |
| Feb 26 | 15.00 | 0.70 | 3.81 | 10.78 | 5.8 | 5.2006 |
| Jan 26 | 15.00 | 0.33 | 4.44 | 10.11 | 5.4 | 5.3380 |
| Dec 25 | 15.00 | 0.33 | 4.26 | 10.30 | 5.1 | 5.4531 |
| Nov 25 | 15.00 | 0.18 | 4.46 | 10.09 | 5.2 | 5.3409 |
| Oct 25 | 15.00 | 0.09 | 4.68 | 9.86 | 5.4 | 5.3855 |
| Sep 25 | 15.00 | 0.48 | 5.17 | 9.34 | 5.6 | 5.3674 |
| Aug 25 | 15.00 | -0.11 | 5.13 | 9.39 | 5.6 | 5.4469 |
| Jul 25 | 15.00 | 0.26 | 5.23 | 9.29 | 5.6 | 5.5285 |
| Jun 25 | 15.00 | 0.24 | 5.35 | 9.16 | 5.8 | 5.5471 |
| May 25 | 14.75 | 0.26 | 5.32 | 8.95 | 6.2 | 5.6674 |
| Apr 25 | 14.25 | 0.43 | 5.53 | 8.26 | 6.6 | 5.7837 |
| Mar 25 | 14.25 | 0.56 | 5.48 | 8.32 | 7.0 | 5.7468 |
| Feb 25 | 13.25 | 1.31 | 5.06 | 7.80 | 6.8 | 5.7656 |
| Jan 25 | 13.25 | 0.16 | 4.56 | 8.31 | 6.5 | 6.0218 |
| Dec 24 | 12.25 | 0.52 | 4.83 | 7.08 | 6.2 | 6.0970 |
| Nov 24 | 11.25 | 0.39 | 4.87 | 6.08 | 6.1 | 5.8071 |
| Oct 24 | 10.75 | 0.56 | 4.76 | 5.72 | 6.2 | 5.6241 |
| Sep 24 | 10.75 | 0.44 | 4.42 | 6.06 | 6.4 | 5.5416 |
| Aug 24 | 10.50 | -0.02 | 4.24 | 6.01 | 6.6 | 5.5526 |
| Jul 24 | 10.50 | 0.38 | 4.50 | 5.74 | 6.8 | 5.5420 |
| Jun 24 | 10.50 | 0.21 | 4.23 | 6.02 | 6.9 | 5.3890 |
| May 24 | 10.50 | 0.46 | 3.93 | 6.33 | 7.1 | 5.1330 |
| Apr 24 | 10.75 | 0.38 | 3.69 | 6.81 | 7.5 | 5.1291 |
| Mar 24 | 10.75 | 0.16 | 3.93 | 6.57 | 7.9 | 4.9801 |
| Feb 24 | 11.25 | 0.83 | 4.50 | 6.46 | 7.8 | 4.9644 |
| Jan 24 | 11.75 | 0.42 | 4.51 | 6.93 | 7.6 | 4.9144 |
| Dec 23 | 11.75 | 0.56 | 4.62 | 6.81 | 7.4 | 4.8972 |
| Nov 23 | 12.25 | 0.28 | 4.68 | 7.23 | 7.5 | 4.8983 |
| Oct 23 | 12.75 | 0.24 | 4.82 | 7.57 | 7.6 | 5.0648 |
| Sep 23 | 12.75 | 0.26 | 5.19 | 7.19 | 7.7 | 4.9370 |
| Aug 23 | 13.25 | 0.23 | 4.61 | 8.26 | 7.8 | 4.9035 |
| Jul 23 | 13.75 | 0.12 | 3.99 | 9.38 | 7.9 | 4.8008 |
| Jun 23 | 13.75 | -0.08 | 3.16 | 10.26 | 8.0 | 4.8516 |
| May 23 | 13.75 | 0.23 | 3.94 | 9.44 | 8.3 | 4.9828 |
| Apr 23 | 13.75 | 0.61 | 4.18 | 9.18 | 8.5 | 5.0197 |
| Mar 23 | 13.75 | 0.71 | 4.65 | 8.69 | 8.8 | 5.2115 |
| Feb 23 | 13.75 | 0.84 | 5.60 | 7.72 | 8.6 | 5.1717 |
| Jan 23 | 13.75 | 0.53 | 5.77 | 7.54 | 8.4 | 5.2007 |
| Dec 22 | 13.75 | 0.62 | 5.78 | 7.53 | 7.9 | 5.2424 |
| Nov 22 | 13.75 | 0.41 | 5.90 | 7.41 | 8.1 | 5.2746 |
| Oct 22 | 13.75 | 0.59 | 6.47 | 6.84 | 8.3 | 5.2503 |
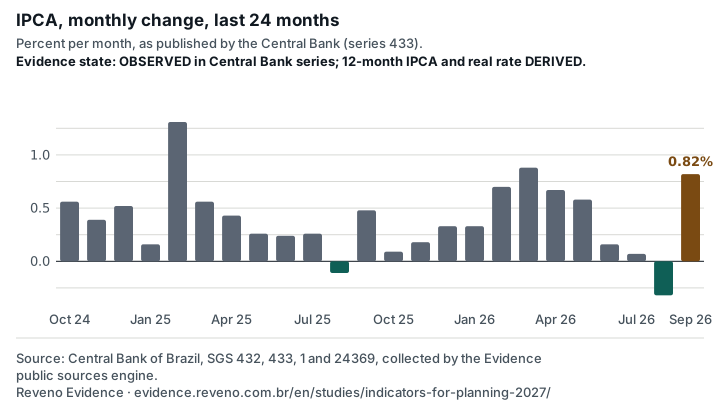
2. Inflation month by month
Monthly IPCA change over the last 24 published months. Columns below zero are months of deflation.
See the table
| Month | IPCA in the month (%) |
|---|---|
| Sep 26 | 0.82 |
| Aug 26 | -0.32 |
| Jul 26 | 0.07 |
| Jun 26 | 0.16 |
| May 26 | 0.58 |
| Apr 26 | 0.67 |
| Mar 26 | 0.88 |
| Feb 26 | 0.70 |
| Jan 26 | 0.33 |
| Dec 25 | 0.33 |
| Nov 25 | 0.18 |
| Oct 25 | 0.09 |
| Sep 25 | 0.48 |
| Aug 25 | -0.11 |
| Jul 25 | 0.26 |
| Jun 25 | 0.24 |
| May 25 | 0.26 |
| Apr 25 | 0.43 |
| Mar 25 | 0.56 |
| Feb 25 | 1.31 |
| Jan 25 | 0.16 |
| Dec 24 | 0.52 |
| Nov 24 | 0.39 |
| Oct 24 | 0.56 |
Method and limits
Series come from the Central Bank SGS, downloaded unchanged by the public sources engine, with SHA-256 checked at publication. The Selic target is the value in force on the last day of the month; the dollar is the average of the month business days; IPCA and unemployment are the published monthly values.
ipca_12m(t) = (Π for i = 0 to 11 of (1 + ipca_month(t − i) / 100) − 1) × 100
ex_post_real_rate(t) = ((1 + selic_target(t) / 100) / (1 + ipca_12m(t) / 100) − 1) × 100
average_dollar(t) = mean of the selling PTAX on business days of month t
What the data does not allow us to say
- This is not a forecast: the study describes what has been published and does not say where the numbers go.
- The ex post real rate uses past inflation; the real rate a company will pay depends on future inflation and on its own cost of credit, which is above the Selic.
- The Selic target is the rate set by Copom, not the effective daily rate.
- Unemployment is a rolling-quarter average; the month shown is the last one of the quarter.
- A national indicator does not describe a region, a sector or a company.
Authorship and review
Written by Thiago Holtz for Reveno Evidence and published on November 6, 2026. Internal review; no independent review yet. Corrections are added here, dated, without deleting the previous version.
History
- Version 1, November 6, 2026: publication.
About this data
- What it measures
- Selic target, monthly and 12-month IPCA, ex post real rate, unemployment and monthly average PTAX dollar, month by month, in the collected window.
- Source
- Central Bank of Brazil, SGS: Meta da taxa Selic definida pelo Copom, IPCA, variação mensal, Taxa de câmbio livre, dólar americano (venda), diária, Taxa de desocupação, PNAD Contínua (trimestre móvel); files in the public sources catalog.
- Unit
- % a year (Selic and real rate), % (IPCA and unemployment), reais per dollar.
- Period
- October 2022 to September 2026.
- Last collected
- Next scheduled collection
- Not applicable: dated edition, with data up to September 2026 (daily series up to 2026-11-03). If the source revises a value within that cut, the page says so and recalculates.
- Maintained by
- Thiago Holtz, Reveno Evidence
- Evidence state
- Observed Derived
- Version
- Collection of 2026-11-03, public sources manifest
- License
- Text, figures and calculations of this study: CC BY 4.0, with attribution to Reveno Evidence and a link to this page. Source data: Central Bank of Brazil, public SGS series, under the Central Bank terms.
Download the data
What is on screen
The tables on this page as CSV, with unformatted numbers and the evidence state of every row.
The full set, with a manifest
A ZIP with every file behind the page, a README with the citation and license, and a manifest with the SHA-256 of each file.
For machines
A JSON at a stable address, with metadata, citation, tables and sources. The address does not change between publications; the content changes when the collection changes.
- dados.json
https://evidence.reveno.com.br/estudos/indicadores-para-planejar-2027/dados.json
- dados.json
How to cite
Short citation for a chart or table caption, or a note
BCB (2026), processed by Reveno Evidence
Full citation with URL and access date
Reveno Evidence (2026). In September 2026, the Selic target was 13.75% and 12-month IPCA inflation 4.58%: a real rate of 8.77% a year, net of past inflation [Data set]. Evidence Studies no. 003, by Thiago Holtz. Source data: Central Bank of Brazil, SGS (series 432, 433, 1 and 24369). Collection of 2026-11-03. Retrieved November 6, 2026, from https://evidence.reveno.com.br/en/studies/indicators-for-planning-2027/
BibTeX
@misc{reveno_evidence_estudo_003,
  author = {{Reveno Evidence}},
  title = {In September 2026, the Selic target was 13.75% and 12-month IPCA inflation 4.58%: a real rate of 8.77% a year, net of past inflation},
  year = {2026},
  publisher = {Reveno},
  url = {https://evidence.reveno.com.br/en/studies/indicators-for-planning-2027/},
  urldate = {2026-11-06},
  note = {Evidence Studies no. 003, by Thiago Holtz. Source data: Central Bank of Brazil, SGS (series 432, 433, 1 and 24369). Collection of 2026-11-03}
}
The access date is filled in with the date of this version of the page; replace it with the date you accessed it.
When you use a number, also cite the source file: id, URL and SHA-256 are in the sources table.
Text, figures and calculations of this study: CC BY 4.0, with attribution to Reveno Evidence and a link to this page. Source data: Central Bank of Brazil, public SGS series, under the Central Bank terms.